Peak(neighborhood, series)
Parameters:
Neighborhood - the number of bars to the left and right of the peak, integer >= 1. This actually defines a peak.
Series - the time series where the peak occurs
True (1) on bars that are the highest in the neighborhood in the series. Returns 0 at other times, including when there are no neighborhood bars to the left and right.
Valley(neighborhood, series)
Parameters:
Neighborhood - the number of bars to the left and right of the valley, integer >= 1. This actually defines a valley.
Series - the time series where the peak occurs
True (1) on bars that are the lowest in the neighborhood in the series.
Note that Or2(Peak(neighborhood, series), Valley(neighborhood, series)) is possible to denote a turning point.
Recognizing Peaks and Valleys
The Peak and Valley indicators are based on the concept of recognizing local peaks and valleys where a time series changes its direction from up to down (peak) and from down to up (valley).
A peak is defined as the point where the high is higher than any other highs in the neighborhood of the point.
A valley is defined as the point where the low is lower than any other lows in the neighborhood of the point.
The neighborhood of a point (Nhood) ranges from the point -Nhood bars to the point + Nhood bars, inclusive of the endpoints. Therefore, the total number of bars included in a turning point analysis is 2*Nhood+1.
The above definitions are illustrated by the chart below.
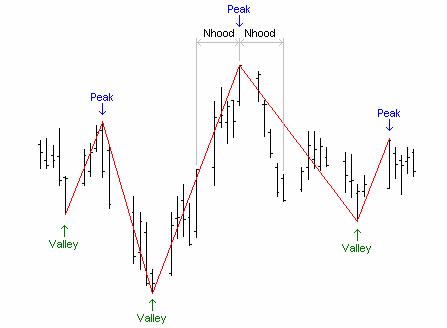
On the chart the neighborhood parameter is Nhood=5. That means that it takes 5 bars to the left and 5 bars to the right of each bar to establish that the central bar is either a peak, a valley, or neither of them.
Due to the fact that Nhood bars are required to the right of a central bar, the most recent turning point on the chart is always located at least Nhood bars away from the most recent bar on the chart. In other words, no peaks or valleys can be established within Nhood bars of the most recent bar on the chart.
The peak and valley indicators are independent of one another, and in fact you can have two or more peaks in a row or two or more valleys in a row. Also note that it is possible for a peak and valley to occur on the same bar. This may occur because the peak uses a default value of high and the valley uses a default value of low. If you have three bars with roughly the same midpoint, and the middle bar has a large range and the surrounding bars have a smaller range, the peak and valley will occur on the middle bar.
Important note – Be careful when using Peak and Valley indicators in a trading system. The reason is that both Peak and Valley indicators require "neighborhood" bars before a peak or valley can occur. Therefore peaks and valleys may arrive in the past meaning that trading signals based on peaks and valleys can change in the past.