Chart for this topic: Cisco and Verizon Proxy.cht
The ProxyEntry and ProxyExit indicators allow you to expand the concept of pairs trading to instruments that are in different price range and therefore would not normally cross. The proxy indicators draw on the NeuroShell Trader's neural nets to create a cointegrated pair, which means that one stock is "computed" as a linear combination of the other, such that the stocks follow one another in a stable fashion and cross prices. You may want to experiment with this method even when the stock or other instrument prices are in the same range.
Stocks will be used in this example, but other instruments may be pair traded.
Like the PairEntry and PairExit indicators, the ProxyEntry and ProxyExit indicators generate simultaneous buy/sell signals for two different chart pages in the same chart. The nets create proxy pairs by using one stock to predict the price of another and using the spread between the actual and predicted prices to pair trade the predicted stock and the one used as an input to the net to make the prediction.
Create a Prediction
For example, if you have stock A with a historical price around $20 a share and stock B around $30 a share, their prices are not likely to cross. You can still trade these two stocks as a pair by using the price of Stock A to predict the price of Stock B. If there are other stocks that might be used to predict Stock B, you can even let the neural net figure out which single stock should be used to predict Stock B.
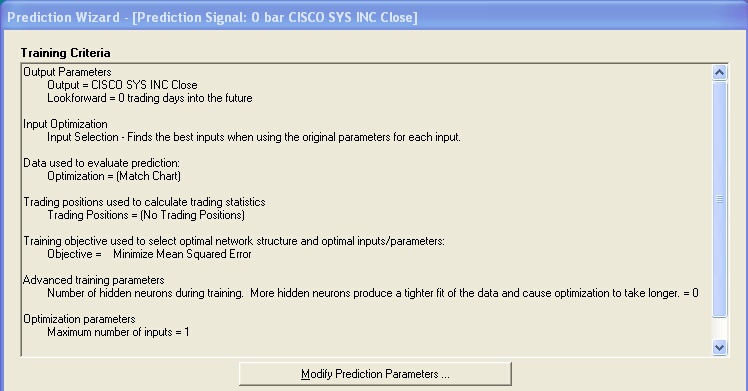
You begin by setting up a chart for the stock that you are trying to predict. In this example we'll predict CISCO. (It doesn't matter which stock is predicted and which one is the input, as long as they follow one another.) Then you insert as other instrument data the close of the stocks you want to use as inputs to the prediction: in our example, Agilent Tech, Juniper, and Verizon. Next you create a prediction with the close of these other stocks as inputs to the net. You set up the Training Criteria as follows:
1. Output tab - for the predicted value, select Other data/Indicators and then choose the close of the stock you're predicting. Set it to predict 0 trading days into the future.
2. Inputs tab - choose Input Selection. You can start with several stocks and let the net decide which is the best one to include in the pair, as long as the net has to choose only one input (see 5 below).
3. Positions tab - select No Trading Positions.
4. Training tab - for training objective, choose Minimize Mean squared Error, and 0 hidden neurons to create a linear model.
5. Optimization tab - set the maximum number of inputs to 1. This forces the net to select only one stock as an input to the net.
Once you've set up the Training Criteria, you can train the prediction until it has a low mean squared error. You can examine the prediction results and see which one of the inputs (stocks) the net used to make the prediction.
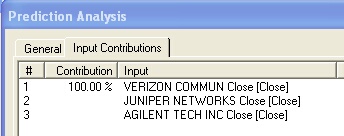
The neural network picked Verizon as the stock that best predicted the price of Cisco.
When training is complete, you can use the spread of the predicted price of Cisco with the actual price of Cisco to generate pair trading signals. The ProxyEntry and ProxyExit indicators will generate simultaneous buy/sell signals for Cisco and Verizon.
Caution - to assure a good hedge, make sure that the prediction is correlated (moves in the same direction) as the input (Verizon in this case). Sometimes the best fit prediction is an inverse of the input, which destroys the hedge.
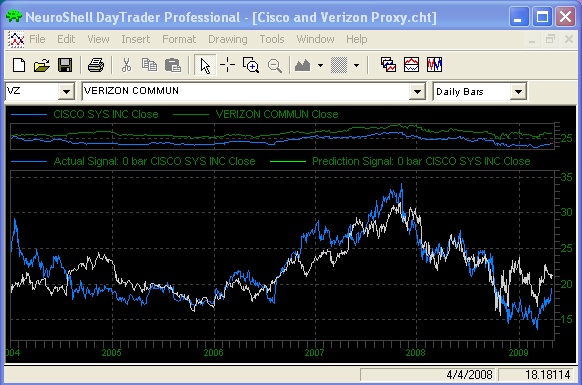
This chart shows that the Cisco and Verizon do not normally cross prices. However, using Verizon to predict the price of Cisco produces a graph that crosses the actual Cisco close with the predicted Cisco close.
Create a Trading Strategy
To begin building the Trading Strategy, you need to add a chart page for Verizon, the winning input to the neural net.
The question then becomes how to make market neutral opposite trades in NeuroShell when both stocks are in the same chart. Usually NeuroShell creates models for each stock that trade independently from one another. The key is to let NeuroShell distinguish between the two chart pages, and know which one it is processing, so it can determine whether to go long or short. The proxy pair indicators keep track of which stock is being processed. The ProxyEntry and ProxyExit indicators are several of a unique class of indicators that produce trading signals that cause the NeuroShell Trader to go long on one stock and simultaneously short on another stock within the same chart. You insert the proxy indicators into a Trading Strategy as follows:
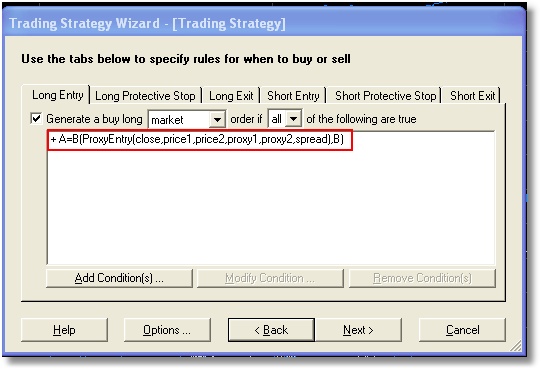
Long Entry conditions:
Relational indicator A = B
A = ProxyEntry indicator from Advanced Indicator Set 3.
B = 1 A value of 1 should be used on a Long Entry and a value of -1 should be used on the Short Entry. These values are used to keep track of the two stocks in the pair trade and should not be optimized.
ProxyEntry conditions for the example
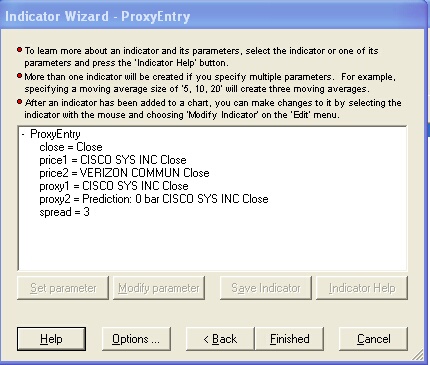
ProxyEntry
Close = Close (Keep the default value. It is used to keep track of the stocks)
Price1 = the close of the first stock in the pairs trade (use the other instrument data version of the close)
Price2 = the close of the second stock in the pairs trade (use the other instrument data version)
Proxy1 = the actual value of the close of the predicted stock (Note: this is not really a proxy in this case)
Proxy2 = the predicted value of the close. (Note: since we are predicting 0 bars ahead, it doesn't really matter whether you use the prediction or the prediction signal.)
Spread = the amount of spread between proxy1 and proxy2 at which must occur before a trade is entered (this may be optimized)
Note: It doesn’t matter which stock is designated as Price1 and which stock is designated as Price2, but it is important that the same stocks be listed in the same order on all of the Long Entry, Long Exit, Short Entry and Short Exit conditions. The same applies to Proxy1 and Proxy2. Listing the stocks in alphabetical order may help you remember the order.
When building the Trading Strategy, the ProxyEntry indicator compares the value of the close, which is different for each chart page, to the value of Price1 and Price2 and determines which stock goes long and which stock goes short. The values of Proxy1 and Proxy2 are used to compute the spread between actual and predicted values from the neural net in order to determine an entry point for the trade.
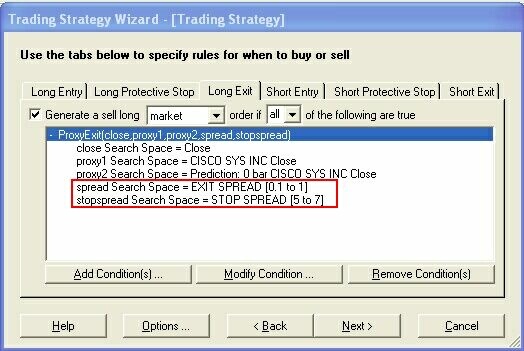
Long Exit conditions:
ProxyExit conditions for the example
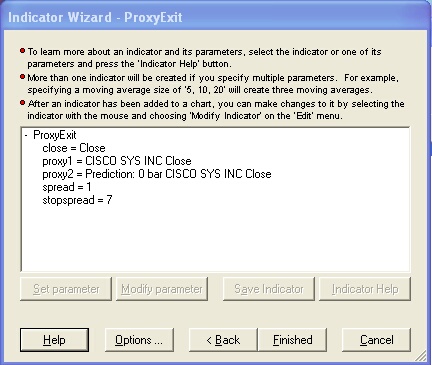
ProxyExit
Close = Close (keep the default value)
Proxy1 = the actual close of the predicted stock
Proxy2 = the predicted value of the stock
Spread = the amount of the spread between the actual and predicted value of the stock where you want to exit a trade (may be optimized)
StopSpread = the “emergency” exit for the trade, equivalent to a stop. This will be a wider spread than the entry spread in the ProxyEntry. If the spread widens, the stop will occur.
Both the ProxyrEntry and ProxyExit conditions cannot be combined with other rules or trailing or protective stops. The ProxyExit indicator includes the StopSpread parameter that can be set as an emergency exit for both stocks. If the StopSpread exit occurs, the trade will not be entered again until the spread falls below the entry spread and then crosses above the entry spread.
Short Entry and Short Exit
Pair trading requires that you enter short entry and exit conditions in addition to the long entry and exits in order to keep the trades in balance. You can copy the ProxyEntry and ProxyExit conditions from the Long side and you only need to make one modification. On the Short Entry tab in the A = B rule, change the value of B to -1 (this value should not be optimized). The Short Exit tab uses the same ProxyExit indicator and settings as the rule in the Long Exit tab.
Linking Entry and Exit Spreads
The NeuroShell Trader can optimize the spread values for you in order to find the best entry and exit points. However, in order for the long and short entries to work in tandem, the spreads need to be the same. The NeuroShell Trader makes it easy to link these values. First set up all of the trading rules as described above. Next go to Trading Strategy parameters, Rules tab, and select parameter search.
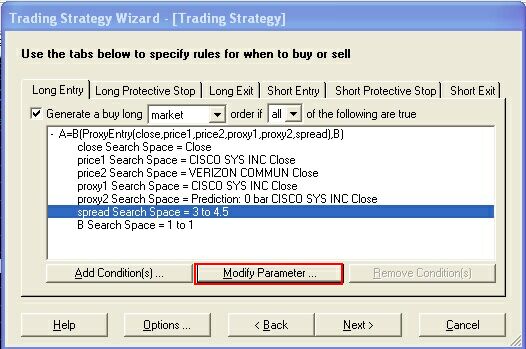
Return to the Long Entry tab and click on the + sign in front of the rule.
Select the spread search space parameter, and then click on the Modify Parameter button.
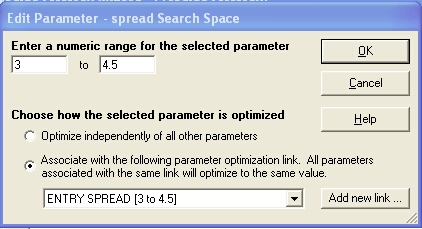
Choose “Associate with the following parameter optimization link” button and click on the Add new link button. Enter a name such as “Entry Spread” and enter an appropriate range for the stock pair. (More on selecting an appropriate range later.)
Next, you need to make the same association on the Short Entry tab. When it comes to choosing a name, select Entry Spread (click on the down arrow if this name is not visible).
On the Long Exit and Short Exit tabs, you need to add a new link for the Exit Spread and another for the Stop Spread (the emergency exit if the spread trade starts going against you) in the ProxyExit indicators.
Selecting Spread Ranges
The default values for the spread parameters should be changed based on the specific pairs being traded. Sometimes you can "eyeball" the spreads between the predicted and actual values of the close and set the ranges appropriately.
Suggested Settings:
Highest entry spread < the lowest stop spread
Highest exit spread < lowest entry spread
Another approach is to calculate the absolute value of the differences between the predicted value and actual value of the close and use this value plus and minus a few price points to set the entry spread ranges, followed by setting the Exit Spread and Stop Spread ranges according to the rules above. (Both the absolute value and subtraction indicators are in the NeuroShell Trader’s Arithmetic category of indicators.) Experience has shown that setting spread values appropriately can greatly effect a model’s success.
Setting Trading Strategy Parameters
Successful trading with proxy pairs requires specific settings for some of the Trading Strategy parameters. These settings are described below:
Rules tab: select Parameter search to allow the genetic algorithm to find the best spreads for the entry and exit rules.
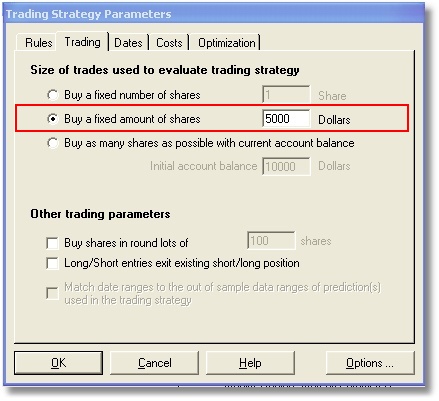
Trading tab: select Buy a fixed amount of shares and enter the dollar (or other currency) amount for each one of the pair. For example, if you enter $5000, you must have $10,000 in your account in order to pay for both sides of a pair trade.
Dates and Costs tabs: set according to your preferences.
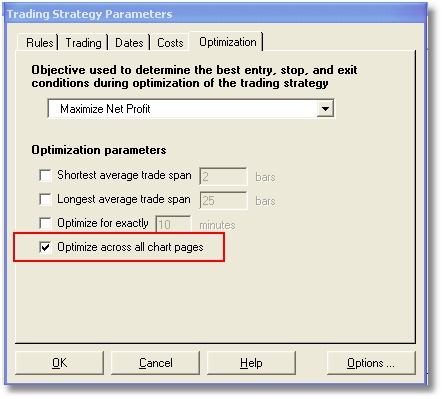
Optimization tab: it is very important that you select the button to optimize across all chart pages in order for your pair trading system to buy and sell both stocks in tandem. The optimization objective is a matter of preference, but you might want to try maximize net profit rather than maximize return on account * equity curve correlation. The balanced nature of pair trading should account for an overall profitable equity curve.
When optimization is finished, click Finished to display the buy/sell signals on the chart. You'll note that when you see a buy signal on one chart page, you should see a corresponding sell signal on the other chart page.