Chart: vRenko S&P Vol 5K Directional Renko.cht
The charts for the InterChart Tools Renko Bar examples described in this help file are installed in the "InterChart Tools Renko Bars Examples" subfolder of the NeuroShell Trader folder.
Here's a chart that tells you when to trade simply based on the moving average of volume Renko bars. The top subgraph in the chart displays the high and low values of 5000 volume Renko bars for the S&P 500 E-Mini.
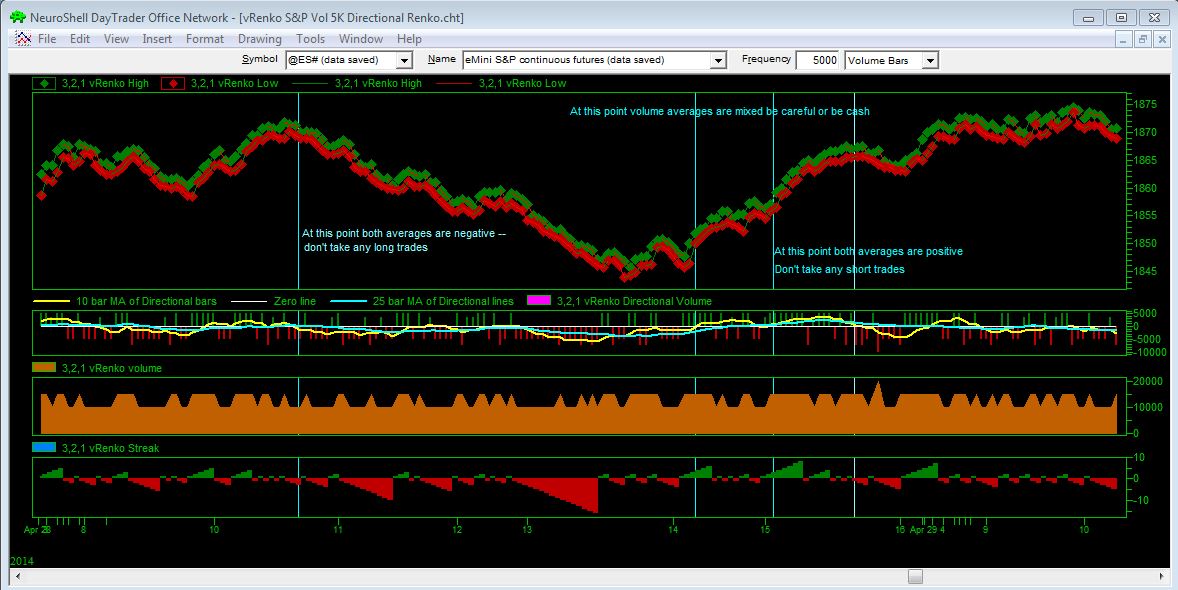
The second subgraph displays the vRenko Steak indicator, which gives you an indication of trends by graphing the number of sequential up or down bars that are created. The count in the streak indicator is reset when there is a move in the opposite direction. The count of up bars is shown as a positive number, while the count of down bars is displayed as a negative number.
All volume indicators in this chart are calculated based on a Virtual Tick size of 5000 shares, 3 ticks required to create an up bar, and 2 ticks required for a down bar, with a multiplier of 1.
The third subgraph simply displays the vRenko volume bars themselves. In this example you can see the difference between up bars which reach the 15000 level (3 ticks for an up bar times 5000 shares) and a down bar which reach the 10,000 level (2 ticks for a down bar times 5000 shares).
You can make trading decisions based on the Directional Renko Volume indicator, which appears in the fourth subgraph. The indicator first determines whether the volume is increasing up or down based upon whether the hidden Streak indicator is greater or lesser than zero, then divides the vRenko Volume by the appropriate up/down bar count. The result is an indicator that displays the advancing/declining price volume per virtual tick.
In this example, we created 10 and 25 bar moving averages of the Directional Renko Volume indicator and made trading decisions based on the indicator's relation to zero. For example, when both moving averages are below zero it is not advisable to enter a long trade, but you might want to enter a short trade. When one moving average is above zero and the other is below zero as happens in segment 2, signals are mixed so you may want to be careful or be in cash. When both moving averages are above zero, it is advisable not to take any short trades, but you may want to enter a long trade.