The InterChart Tools Renko bars are virtual and perform their calculations using the same methods as traditional Renko bars, but once a trading signal is generated by the Renko bar, both the trade and fill are correctly displayed on the open of the next bar of the base chart.
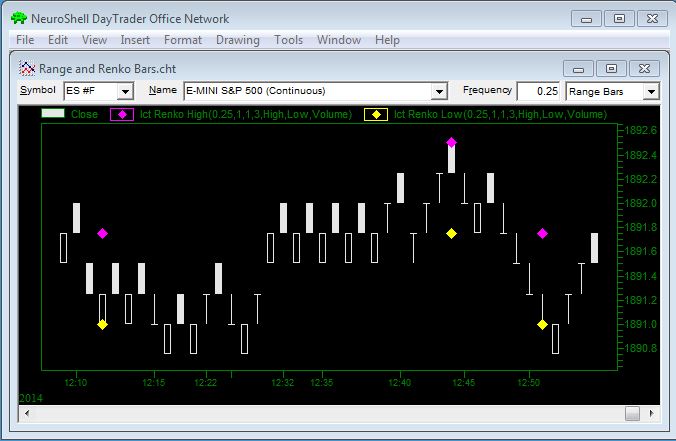
The S&P E-Mini chart shown above is based on 0.25 range bars. The IctRenko High (0.25, 1, 1, 3, High, Low, Volume) is shown as pink dotes, while the IctRenko Low (0.25, 1, 1, 3, High, Low, Volume) is shown as yellow dots.
The range bars occur more frequently on the chart because a price fluctuation of 0.25 is all that is required to form a bar. The Renko bars shown occur less often because the Bar Size Multiplier of 3 requires a price fluctuation of 0.75 in the same direction before a bar is formed, thus eliminating noise in the price data.
Renko Bar Parameters
The smaller the virtual tick size, the more Renko Bars will be generated with the potential for more whipsaw trades. Larger virtual tick sizes would mean bigger changes in price and more delayed entries.
The Virtual Tick Size may vary based on bar size of the base chart because a Renko Bar is only formed after the close of a bar on the base chart. If a stock is trading in the $20 range, you may want to use a Virtual Tick Size of $0.10. You might want to set the Virtual Tick Size to $0.25 or even $0.50 for higher price stocks. If a security is very volatile, you may want to set the Virtual Tick Size larger to screen out noise.
Setting Virtual Tick Size Too Small
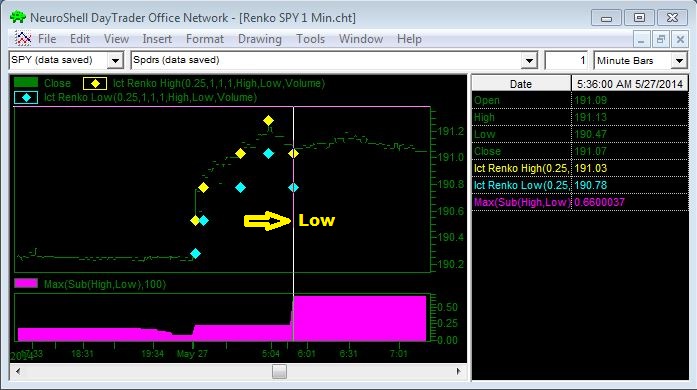
If you set the Virtual Tick Size smaller than the maximum value of the difference between the high and low values on the chart, you run the risk that a Renko bar will be formed that ignores a real price point due to the rules for forming Renko bars.
In the chart above, the low value is 190.47, while the Renko Low is stated as 190.78. What happened?
In this case the Virtual Tick Size of 0.25 used in the Renko High and Low indicators was not large enough to cover an expected price difference between the high and low. On the bar in question, the actual difference between the high and low on the 1 minute bar is 0.6600037* (191.13 - 190.47).
*This value is calculated using the Maximum Value indicator from the NeuroShell Trader Basic indicator category. The default value of close for the Time Series parameter is replaced with the Subtract indicator from the Arithmetic category, and the two indicator parameters are the High and Low.
The Virtual Tick Size parameter in the indicators of 0.25 corresponds to the size of the base chart's range bar which is used to create the virtual Renko bars. You need to specify a size that will not be overcome by noise for the security that is being traded. In the example shown it is the actual tick size. The next two parameters represent the number of ticks used to calculate the up part of the Renko bar, followed by the number of ticks used to compute the down part. The 3 represents a multiplier that is applied to the described Renko bar's up/down ratio to realize it's final size. This enables the indicators to use a different number of ticks for the up and down side of the Renko bars. Since any bar's function is to absorb noise and rising price jitter is often different from falling price jitter, our Renko bars permit an asymmetrical definition to accommodate this.
NeuroShell Renko bars may, at the user's discretion, be controlled by the optimizer to identify the optimal bar size and noise absorption for a given algorithm or equity.
LInking Parameters in a Trading Strategy
If you are creating Trading Strategies with Renko bars, it is important to link parameters such as Ticks per Up Bar, Ticks per Down Bar, and Bar size Multiplier if you plan to optimize them. The Virtual Tick Size must be set to the same value in the entire chart. The virtual Tick Size must never be optimized.
Cautions
Price data may appear outside of the range of Ict Renko bars or any Renko bars because in order for a new Renko bar to be created, the price movement must be in the same direction. For example, if the Virtual Tick Size is set to 0.25 and the price moves upward 0.30 and then goes down by 0.50, only one Renko bar is created to represent the 0.25 movement upward, and two Renko bars are created to represent the 0.50 movement downward. The Ict Renko bars may only show price movements up or down that are either equal to the amount of the Virtual Tick Size or a multiple of the Virtual Tick Size.